
Filter by
SubjectRequired
LanguageRequired
The language used throughout the course, in both instruction and assessments.
Learning ProductRequired
LevelRequired
DurationRequired
SkillsRequired
SubtitlesRequired
EducatorRequired
Results for "planogram"
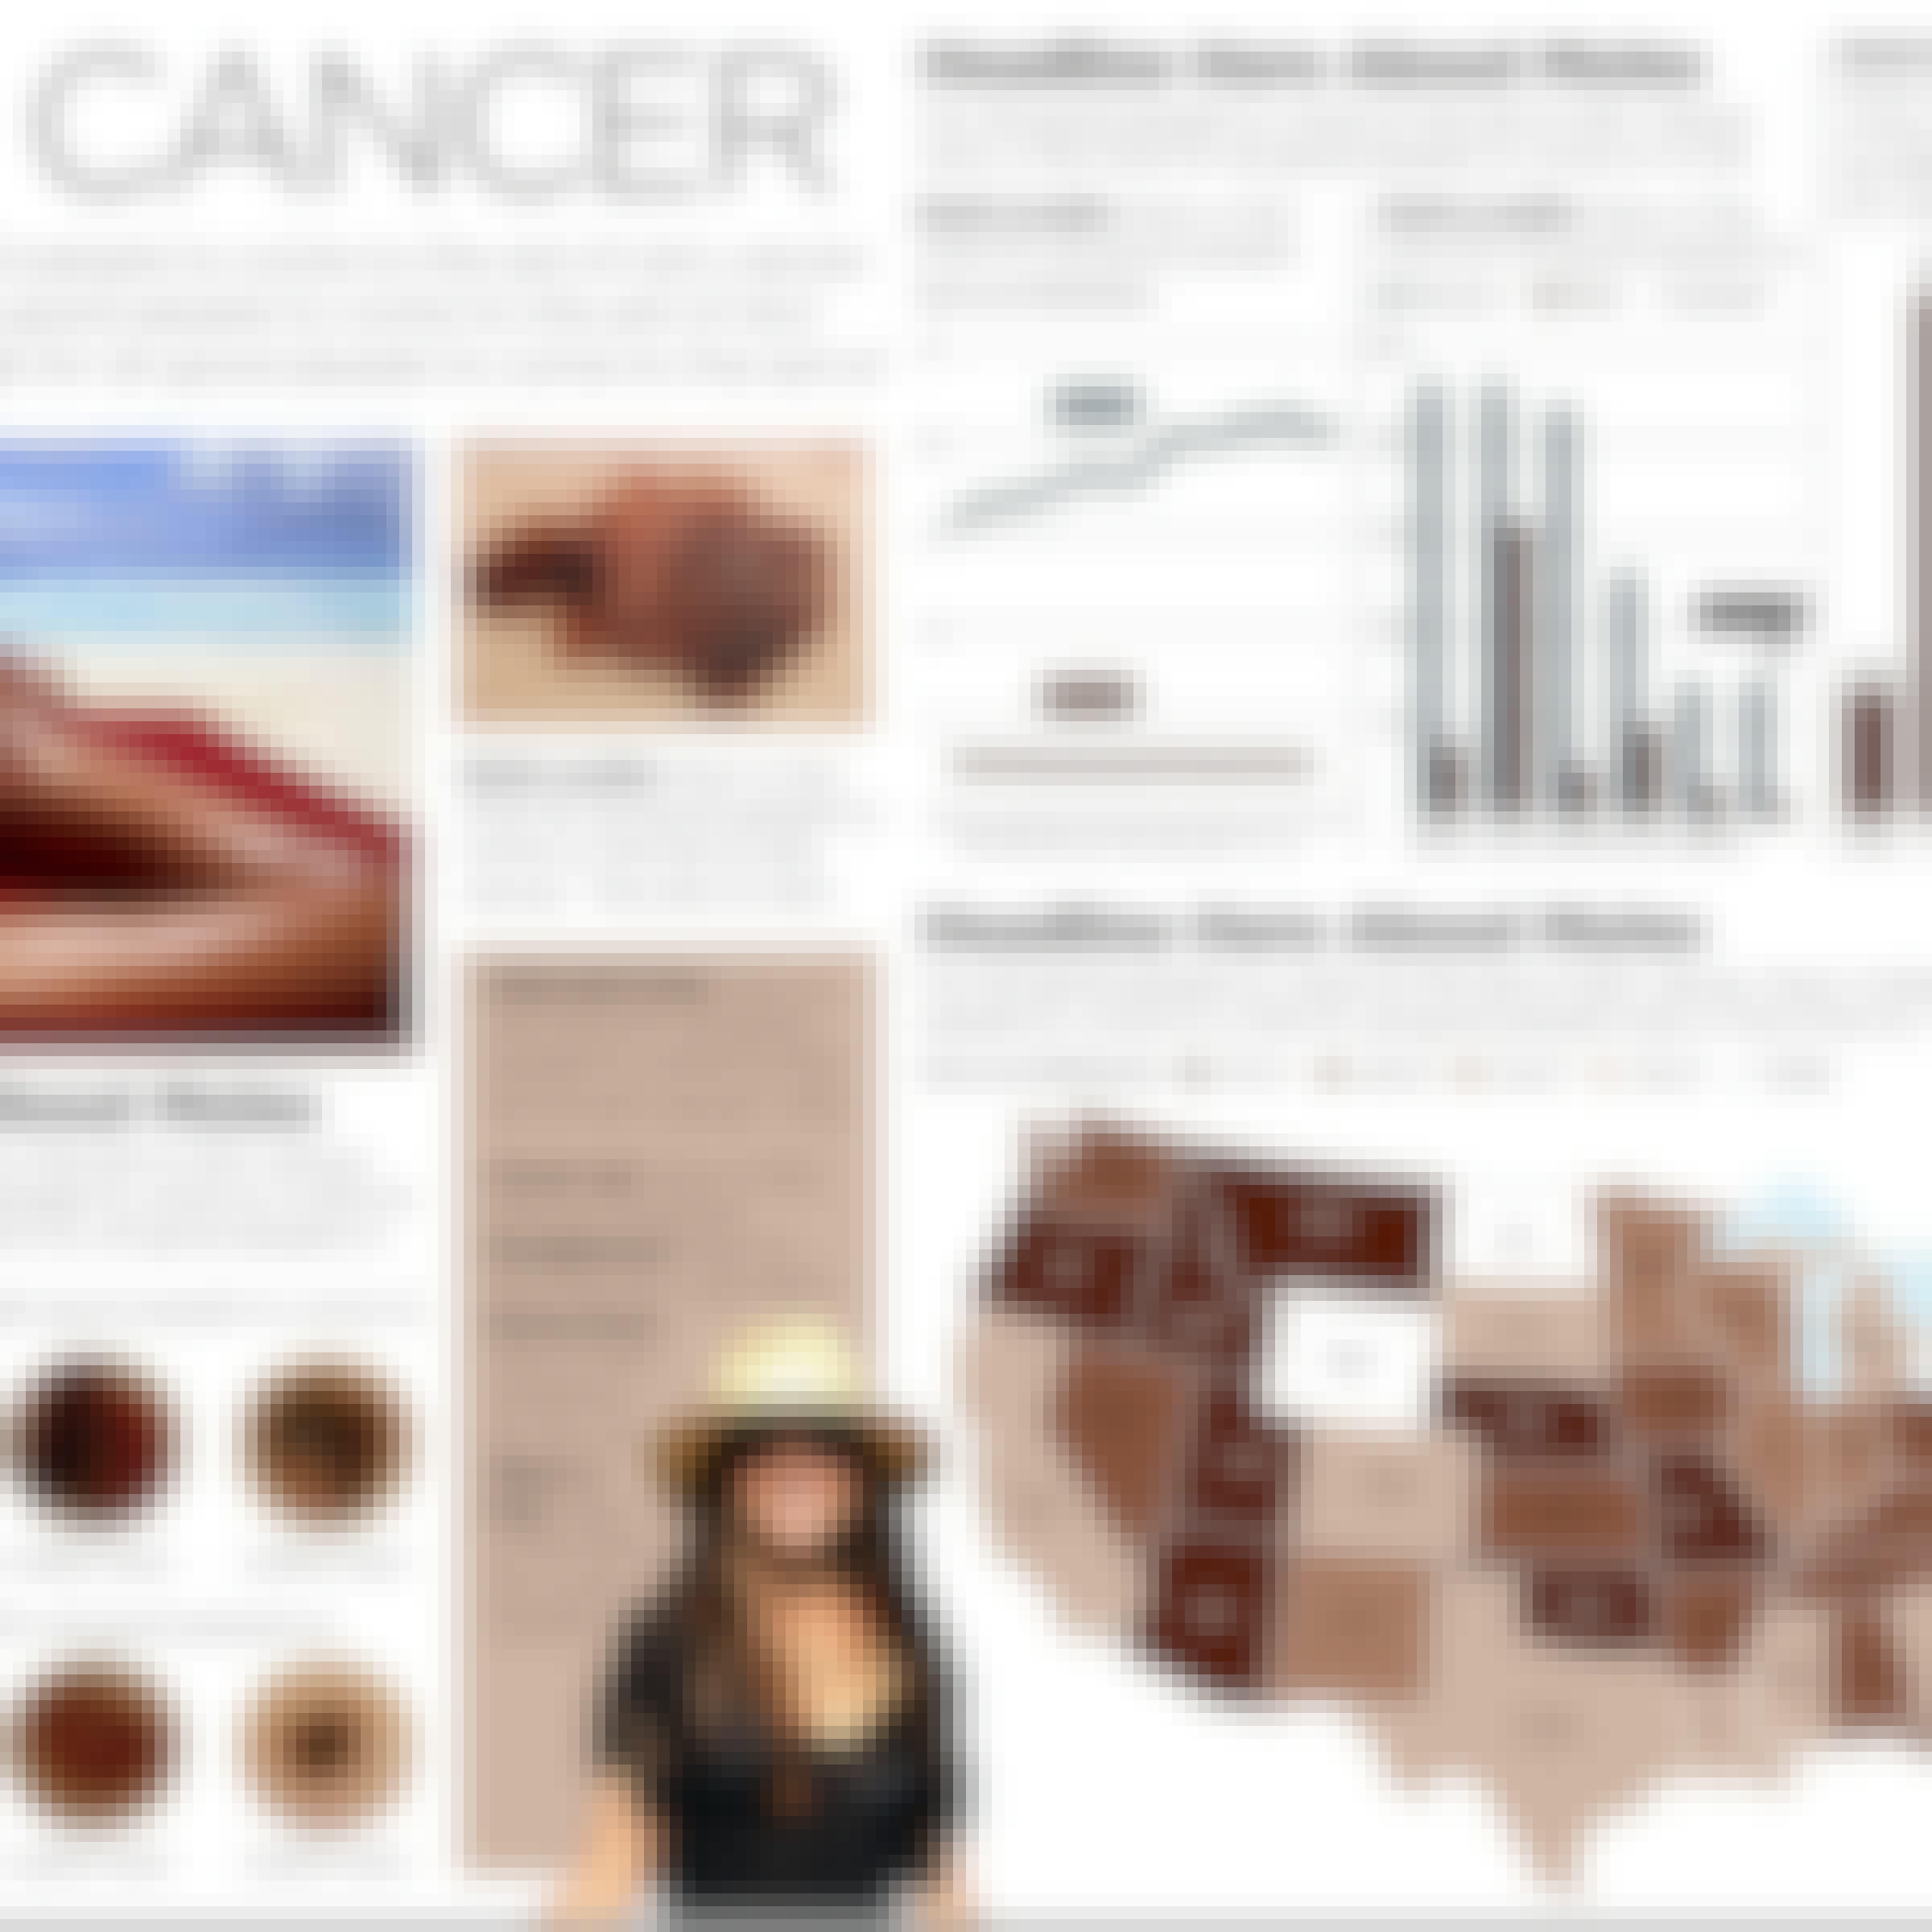
Michigan State University
Skills you'll gain: Infographics, Adobe Illustrator, Graphic and Visual Design, Data Mapping, Typography, Design Elements And Principles, Graphical Tools, Storytelling, Color Theory
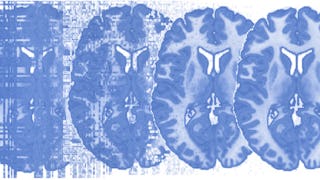
Johns Hopkins University
Skills you'll gain: Magnetic Resonance Imaging, Data Analysis, Analysis, Image Analysis, Statistical Analysis, Experimentation, Network Analysis, Research Design, Regression Analysis, Psychology, Time Series Analysis and Forecasting, Matlab, Mental and Behavioral Health, Neurology, Statistical Modeling, Statistical Methods, Research

Johns Hopkins University
Skills you'll gain: Ggplot2, Scatter Plots, Plot (Graphics), Data Visualization, Data Visualization Software, Heat Maps, R Programming, Graphical Tools, Data Wrangling, Tidyverse (R Package), Graphics Software

University of Illinois Urbana-Champaign
Skills you'll gain: Data Visualization, Interactive Data Visualization, Data Presentation, Infographics, Data Visualization Software, Data Storytelling, Plotly, Matplotlib, Journalism, Graphing, Data Literacy, Color Theory, Data Manipulation, Design Elements And Principles

Johns Hopkins University
Skills you'll gain: Ggplot2, Data Visualization Software, Datamaps, Visualization (Computer Graphics), Interactive Data Visualization, Scatter Plots, Histogram, Graphic and Visual Design, R Programming, Geographic Information Systems, Software Development
 Status: Free
Coursera Instructor Network
Skills you'll gain: Data Visualization, Data-Driven Decision-Making, Data Visualization Software, Data Literacy, Interactive Data Visualization, Business Intelligence, Data Storytelling, Data Presentation, Dashboard
 Status: Free
Coursera Project Network
Skills you'll gain: Presentations, Microsoft PowerPoint, Data Visualization, Data Storytelling, Video Editing

Johns Hopkins University
Skills you'll gain: Rmarkdown, Tidyverse (R Package), Ggplot2, Spatial Data Analysis, Data Visualization Software, Plot (Graphics), Statistical Visualization, Data Manipulation, Scatter Plots, Plotly, Interactive Data Visualization, R Programming, Data Mapping, Animations
 Status: New
University of Colorado Boulder
Skills you'll gain: Dashboard, Data Visualization Software, Tableau Software, Data Visualization, Interactive Data Visualization, Data Storytelling, Data Analysis, Statistical Visualization, Geospatial Mapping, Histogram, Advanced Analytics, Spatial Analysis, Scatter Plots, Data Manipulation, Data Presentation, Data Import/Export, Forecasting
MathWorks
Skills you'll gain: Image Analysis, Matlab, Computer Vision, Automation Engineering, Computer Graphics
 Status: Free
Coursera Project Network
Skills you'll gain: Data Presentation, Data Literacy, Data Synthesis, Data Visualization Software, Google Sheets, Graphing

Skills you'll gain: Matplotlib, Pandas (Python Package), Data Import/Export, Data Visualization Software, Microsoft Excel, NumPy, Time Series Analysis and Forecasting, Data Analysis, Data Manipulation, Python Programming
In summary, here are 10 of our most popular planogram courses
- Design and Make Infographics (Project-Centered Course): Michigan State University
- Principles of fMRI 2: Johns Hopkins University
- Data Visualization in R with ggplot2: Johns Hopkins University
- Visualization for Data Journalism: University of Illinois Urbana-Champaign
- Building Data Visualization Tools: Johns Hopkins University
- Introduction to Data Visualization in Qlik Sense: Coursera Instructor Network
- How To Visualize Your Data Using Microsoft Powerpoint: Coursera Project Network
- Advanced Data Visualization with R: Johns Hopkins University
- Data Visualization & Analytics in Tableau: University of Colorado Boulder
- Low Code Image Segmentation: MathWorks


