
Filter by
SubjectRequired
LanguageRequired
The language used throughout the course, in both instruction and assessments.
Learning ProductRequired
LevelRequired
DurationRequired
SkillsRequired
SubtitlesRequired
EducatorRequired
Explore the Graph Course Catalog

University of California San Diego
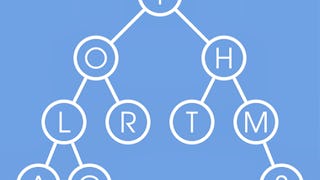
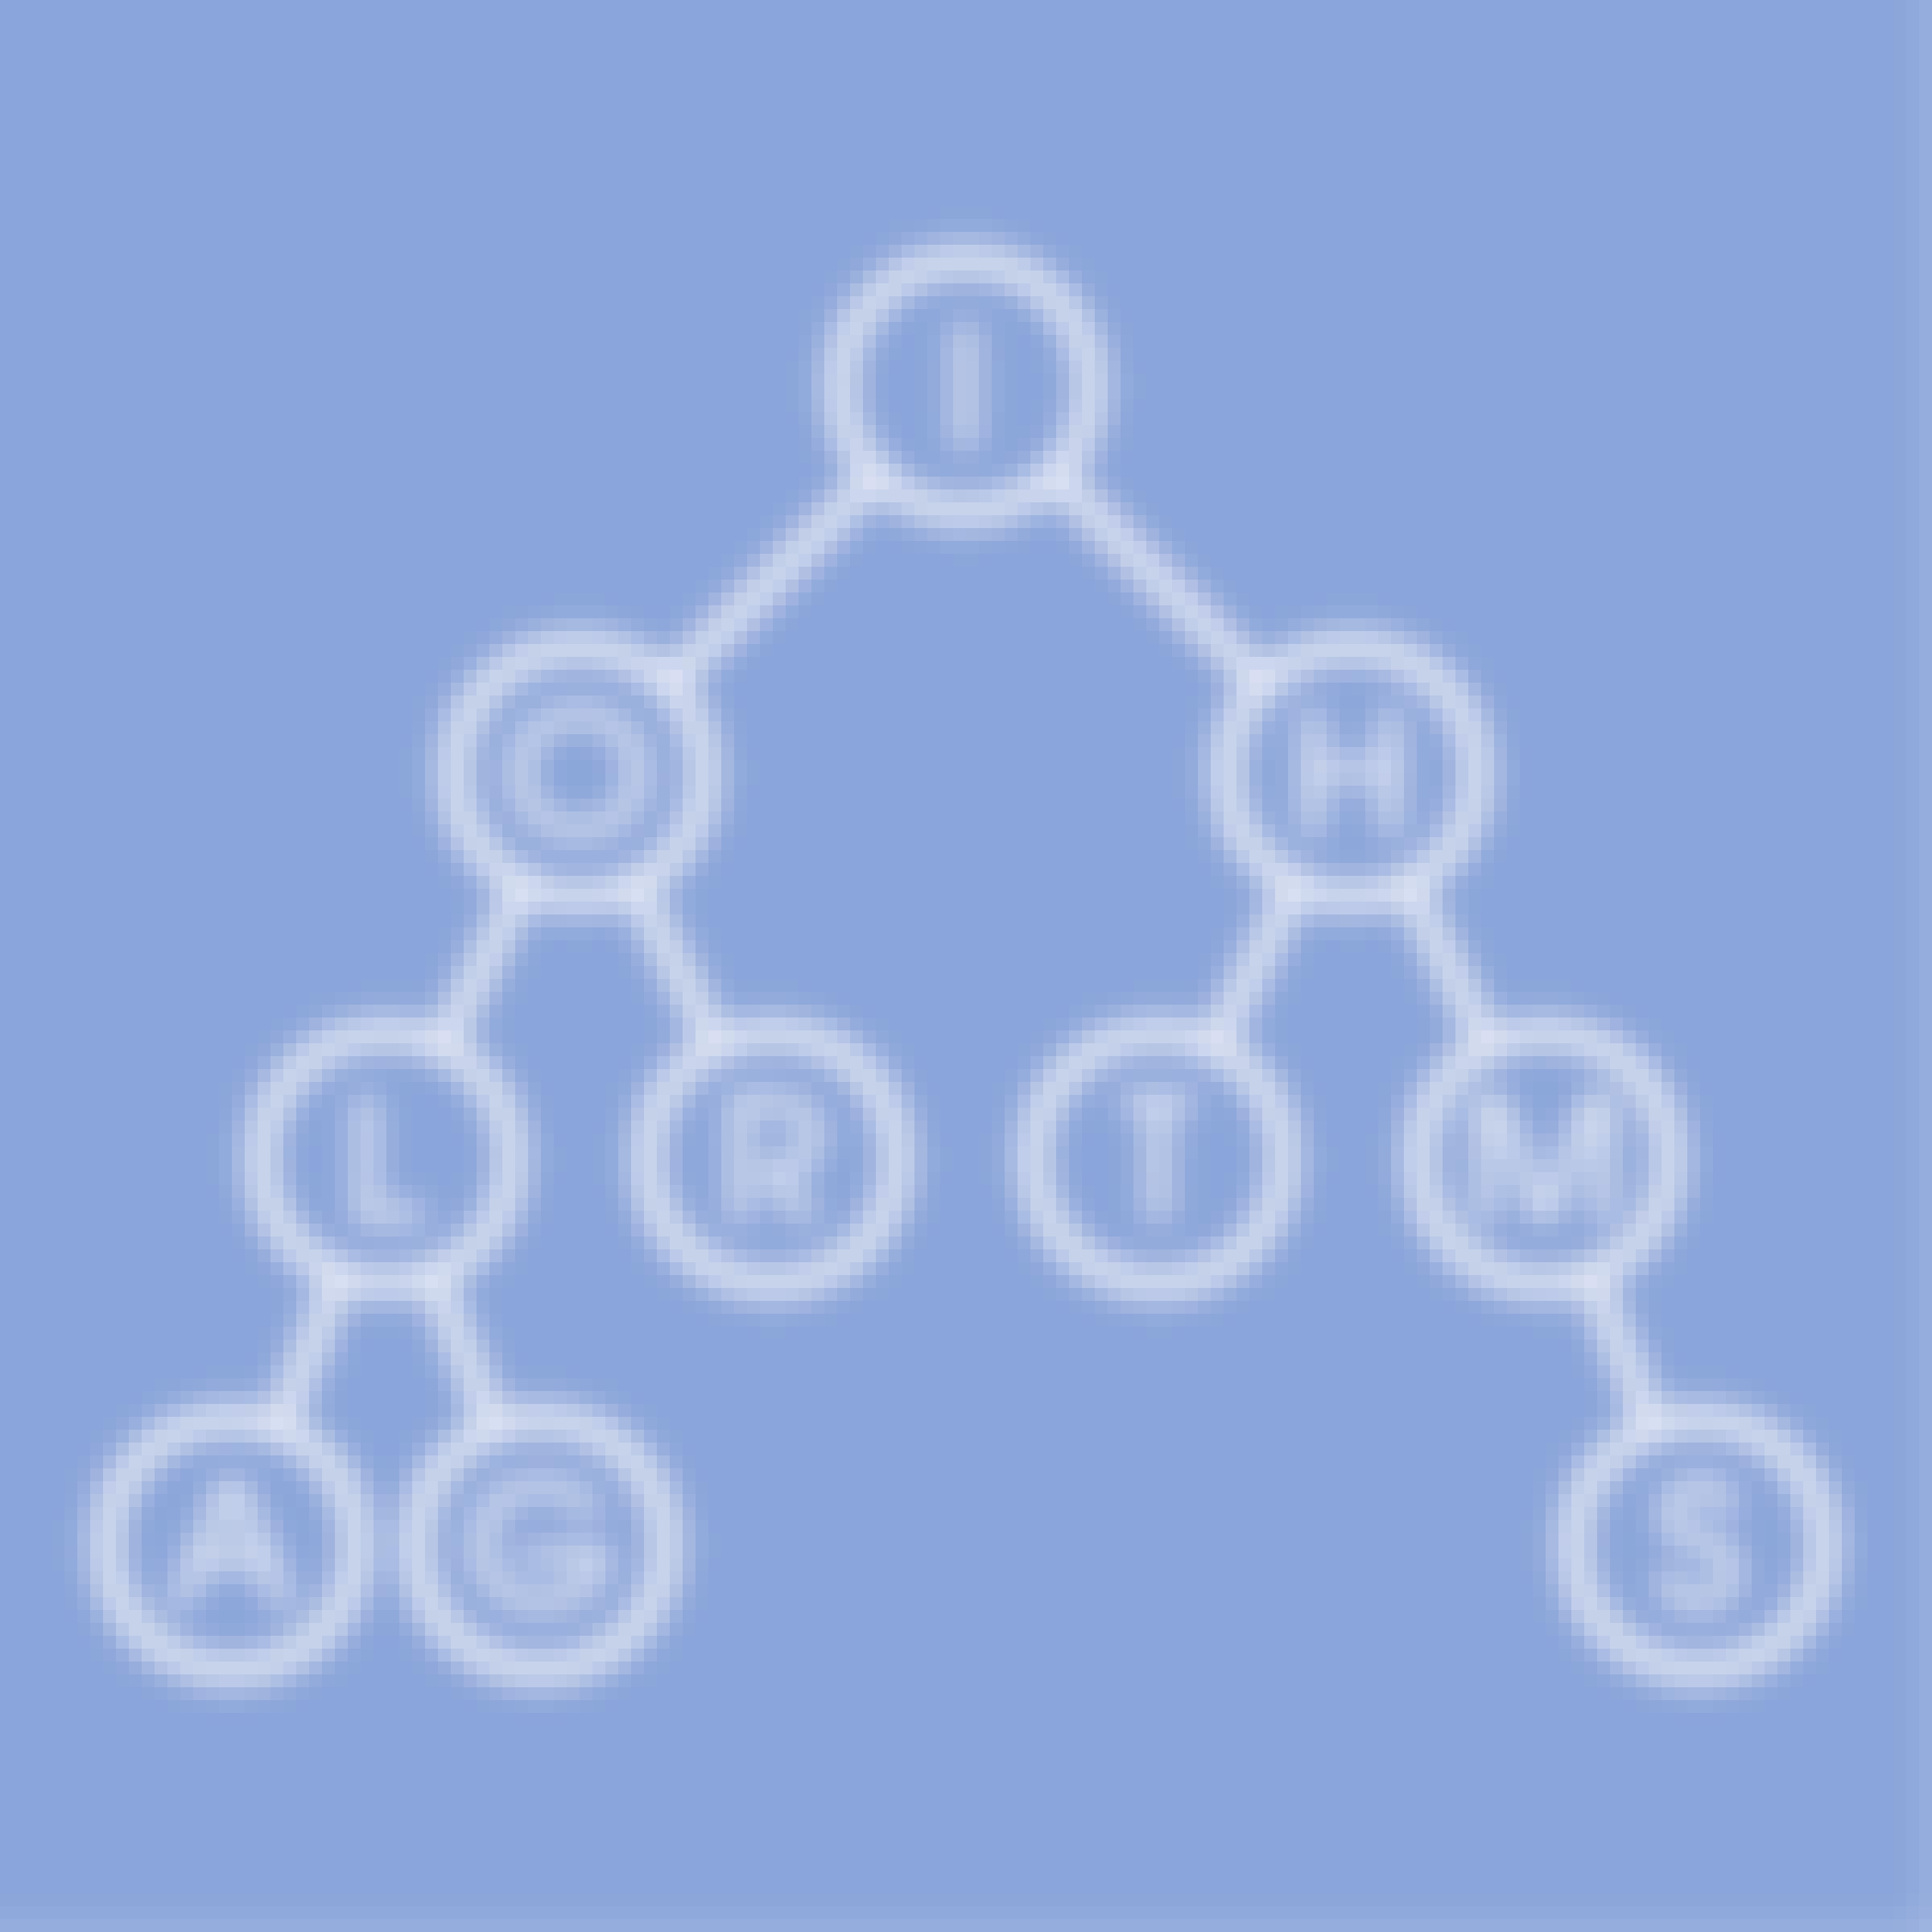
Skills you'll gain: Graph Theory, Data Structures, Java Programming, Java, Object Oriented Design, Software Design, Algorithms, Theoretical Computer Science, Maintainability, Object Oriented Programming (OOP), Network Routing, Computational Thinking, Application Development, Debugging

University of Minnesota
Skills you'll gain: Health Informatics, Health Technology, Telehealth, Interoperability, Electronic Medical Record, Health Care, Health Information Management, Community Health, Health Systems, Public Health, Data Ethics, Nursing, Information Privacy, Medical Terminology

Universidad Nacional Autónoma de México
Skills you'll gain: NoSQL, Database Systems, MongoDB, Data Store, Databases, Database Design, Relational Databases, Query Languages, Apache Cassandra, Scalability, Graph Theory, Unstructured Data, Maintainability
 Status: Free
Shanghai Jiao Tong University
Skills you'll gain: Combinatorics, Graph Theory, Theoretical Computer Science, Mathematical Theory & Analysis, Advanced Mathematics, Network Analysis, Computational Thinking, Algorithms, Data Structures, Computer Science
University of California San Diego
Skills you'll gain: Bioinformatics, Graph Theory, Epidemiology, Infectious Diseases, Network Analysis, Program Development, Molecular Biology, Computational Thinking, Algorithms

Coursera Project Network
Skills you'll gain: Plotly, Interactive Data Visualization, Data Visualization Software, Scatter Plots, Ggplot2, Data Analysis
University of Colorado Boulder
Skills you'll gain: Data Visualization Software, Interactive Data Visualization, Visualization (Computer Graphics), User Centered Design, Statistical Visualization, Data Presentation, Usability, Data Storytelling, Human Computer Interaction, User Research, Usability Testing, Requirements Analysis, Design Elements And Principles
 Status: Free
The University of Edinburgh
Skills you'll gain: Precision Medicine, Bioinformatics, Image Analysis, Medical Imaging, Big Data, Health Informatics, Statistical Methods, Data Science, Machine Learning, Natural Language Processing, Probability & Statistics, Data Analysis, Molecular Biology, Network Analysis, Graph Theory, Healthcare Ethics

Coursera Project Network
Skills you'll gain: Performance Testing, Test Tools, Test Execution Engine, Application Performance Management, Test Data
University of California San Diego
Skills you'll gain: Algorithms, Network Routing, Network Model, Graph Theory, Operations Research, Theoretical Computer Science, Network Analysis, Data Structures, Computational Thinking, Linear Algebra, Computer Science, Big Data, Probability & Statistics
 Status: Free
Coursera Project Network
Skills you'll gain: Timelines, Project Schedules, Google Sheets, Scheduling, Spreadsheet Software

University of Illinois Urbana-Champaign
Skills you'll gain: Data Mining, Big Data, Anomaly Detection, Text Mining, Unstructured Data, Spatial Analysis, Advanced Analytics, Image Analysis, Algorithms, Information Privacy
In summary, here are 10 of our most popular graph courses
- Advanced Data Structures in Java: University of California San Diego
- Interprofessional Healthcare Informatics : University of Minnesota
- NoSQL systems: Universidad Nacional Autónoma de México
- Discrete Mathematics: Shanghai Jiao Tong University
- Genome Assembly Programming Challenge: University of California San Diego
- Data Visualization with Plotly Express: Coursera Project Network
- Fundamentals of Data Visualization: University of Colorado Boulder
- Data Science in Stratified Healthcare and Precision Medicine: The University of Edinburgh
- Performance Testing with JMeter for absolute beginners: Coursera Project Network
- Advanced Algorithms and Complexity: University of California San Diego


