
Filter by
SubjectRequired
LanguageRequired
The language used throughout the course, in both instruction and assessments.
Learning ProductRequired
LevelRequired
DurationRequired
SkillsRequired
SubtitlesRequired
EducatorRequired
Explore the Infographics Course Catalog
 Status: Free
Indian Institute for Human Settlements
Skills you'll gain: Editing, Storytelling, Writing and Editing, Photography, Journalism, Blogs, Content Creation, Infographics, Writing, Media and Communications, Research, Instagram

University of California, Irvine
Skills you'll gain: Dashboard, Data Storytelling, Data Presentation, Interactive Data Visualization, Data Visualization Software, Tableau Software, Geospatial Information and Technology, Data Analysis, Analytical Skills, Application Deployment, Network Analysis, Financial Data, Financial Analysis, Time Series Analysis and Forecasting
 Status: New
Coursera Project Network
Skills you'll gain: Dashboard, Data Visualization, Interactive Data Visualization, Data Presentation, Tableau Software, Data Visualization Software, Exploratory Data Analysis, Data Analysis
Coursera Project Network
Skills you'll gain: Data Storytelling, Data Presentation, Data-Driven Decision-Making, Interactive Data Visualization, Dashboard, Data Visualization Software, Tableau Software, Data Analysis, Exploratory Data Analysis

Northeastern University
Skills you'll gain: Data Storytelling, Dashboard, Data Visualization, Data Presentation, Interactive Data Visualization, Infographics, Data Literacy, Tableau Software, Data Visualization Software, Presentations, Statistical Visualization, Storytelling, Design Elements And Principles, Key Performance Indicators (KPIs), Stakeholder Communications
 Status: Free
Coursera Project Network
Skills you'll gain: Datamaps, Interactive Data Visualization, Heat Maps, Data Visualization Software, Statistical Visualization, Data Storytelling, Data Presentation, Data Wrangling, Data Access, Correlation Analysis, Scatter Plots, Exploratory Data Analysis

Coursera Project Network
Skills you'll gain: Canva (Software), Design Elements And Principles, Graphic and Visual Design, Content Creation, Graphic and Visual Design Software, Graphic Design, Photo Editing
 Status: Free
Coursera Project Network
Skills you'll gain: Plotly, Exploratory Data Analysis, Scatter Plots, Plot (Graphics), Data Visualization Software, Interactive Data Visualization
 Status: Free
Coursera Project Network
Skills you'll gain: Data Visualization, Sales Process, Sales Presentations, Customer Relationship Management (CRM) Software, Target Market, Target Audience, Market Analysis, Presentations, User Accounts
 Status: Free
Coursera Project Network
Skills you'll gain: Exploratory Data Analysis, Box Plots, Plot (Graphics), Ggplot2, Data Visualization Software, Statistical Visualization, Scatter Plots, Histogram, Graphing

Coursera Project Network
Skills you'll gain: Infographics, Data Presentation, Interactive Data Visualization, Generative AI, Data Storytelling, Dashboard, Analytics, Artificial Intelligence, Data Visualization Software, Data Analysis

Coursera Project Network
Skills you'll gain: Dashboard, Interactive Data Visualization, Data Presentation, Tableau Software, Data Visualization Software, Data Analysis Software, Digital Publishing, Key Performance Indicators (KPIs), Data Import/Export
In summary, here are 10 of our most popular infographics courses
- Writing and Disseminating Grey Literature: Indian Institute for Human Settlements
- Dashboarding and Deployment: University of California, Irvine
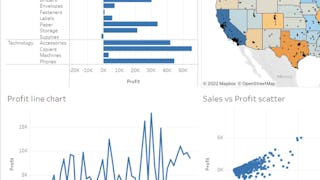
- Dynamic Dashboards with Tableau: Advanced Sales Analysis: Coursera Project Network
- Data Visualization in Tableau: Create Dashboards and Stories: Coursera Project Network
- Designing Engaging Dashboards for Healthcare Analytics: Northeastern University
- Choisir la Meilleure Méthode pour Illustrer les Données: Coursera Project Network
- How to create Social Media graphics using Canva: Coursera Project Network
- Data Visualization using Plotly: Coursera Project Network
- Build Customizable Sales Presentation Graphics using Canva: Coursera Project Network
- Data Visualization using Plotnine and ggplot: Coursera Project Network


