Filter by
SubjectRequired
LanguageRequired
The language used throughout the course, in both instruction and assessments.
Learning ProductRequired
LevelRequired
DurationRequired
SkillsRequired
SubtitlesRequired
EducatorRequired
Explore the Cartography Course Catalog

Coursera Project Network
Skills you'll gain: Data Storytelling, Plotly, Data Presentation, Matplotlib, Interactive Data Visualization, Seaborn, Data Visualization, Data Visualization Software, Statistical Visualization, Scatter Plots
 Status: New
Skills you'll gain: Unreal Engine, Virtual Environment, Computer Graphics, Game Design, Visualization (Computer Graphics), Video Game Development, Scalability, Performance Tuning
 Status: Free
Coursera Project Network
Skills you'll gain: Wireframing, Mockups, Web Design, Information Architecture, Collaborative Software, User Experience Design, Content Management
 Status: Free
Coursera Project Network
Skills you'll gain: Infographics, Interactive Data Visualization, Storytelling, Storyboarding, Graphic and Visual Design
 Status: New
University of Colorado Boulder
Skills you'll gain: Matplotlib, Plotly, Seaborn, Data Visualization Software, Statistical Visualization, Interactive Data Visualization, Scatter Plots, Box Plots, Heat Maps, Histogram
 Status: New
University of Pennsylvania
Skills you'll gain: Data Storytelling, Data Presentation, Data Visualization Software, Tableau Software, Presentations, Interactive Data Visualization, Verbal Communication Skills, Data Analysis, Pivot Tables And Charts, Scatter Plots, Stakeholder Communications, Spatial Analysis, Trend Analysis
 Status: Free
California Institute of the Arts
Skills you'll gain: Graphic Design, Typography, Graphic and Visual Design, Design Elements And Principles, Adobe Creative Cloud, Color Theory, Design Software, Adobe Illustrator, Adobe Photoshop, Photo Editing, Computer Graphic Techniques, Creativity
 Status: Free
Coursera Project Network
Skills you'll gain: Datamaps, Interactive Data Visualization, Heat Maps, Data Visualization Software, Statistical Visualization, Data Storytelling, Data Presentation, Data Wrangling, Data Access, Correlation Analysis, Scatter Plots, Exploratory Data Analysis
 Status: Free
Coursera Project Network
Skills you'll gain: Education Software and Technology, Information Architecture, Animations
 Status: Free
Coursera Project Network
Skills you'll gain: Canva (Software), Marketing Design, Color Theory, Graphic and Visual Design Software, Graphic and Visual Design, Creative Design, Marketing Collateral
Coursera Project Network
Skills you'll gain: UI/UX Research, User Research, Design Thinking, User Experience, Persona (User Experience), Technical Communication, User Centered Design, Usability
 Status: New
Johns Hopkins University
Skills you'll gain: Data Presentation, Graphic and Visual Design, Data Storytelling, Design Elements And Principles, Plot (Graphics), Data Literacy, Exploratory Data Analysis, Scatter Plots
In summary, here are 10 of our most popular cartography courses
- Data Visualization & Storytelling in Python: Coursera Project Network
- Landscapes and Open World Creation: Packt
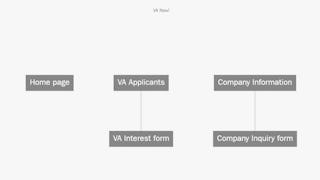
- Build a Website Map with Jumpchart: Coursera Project Network
- Create an infographic with Infogram : Coursera Project Network
- BiteSize Python: Data Visualization: University of Colorado Boulder
- Data Viz Using Tableau & Presenting With Storytelling: University of Pennsylvania
- Grundlagen des Grafikdesigns: California Institute of the Arts
- Choisir la Meilleure Méthode pour Illustrer les Données: Coursera Project Network
- Use Genially to Create Mind Maps: Coursera Project Network
- Créer une carte de visite professionnelle avec Canva: Coursera Project Network


