
Filter by
SubjectRequired
LanguageRequired
The language used throughout the course, in both instruction and assessments.
Learning ProductRequired
LevelRequired
DurationRequired
SkillsRequired
SubtitlesRequired
EducatorRequired
Results for "heat maps"
Skills you'll gain: Environmental Regulations, Environmental Engineering, Process Engineering, Chemical Engineering, Production Process, Thermal Management, Three-Phase, Mechanical Engineering, Equipment Design, Safety and Security
 Status: Free
Coursera Project Network
Skills you'll gain: Wireframing, Mockups, Web Design, Information Architecture, Collaborative Software, User Experience Design, Content Management
 Status: Free
DeepLearning.AI
Skills you'll gain: Google Cloud Platform, Cloud Computing, Generative AI, Cloud Management, Applied Machine Learning, Datamaps, Real Time Data
 Status: Free
Coursera Project Network
Skills you'll gain: Interactive Data Visualization, Data Mapping, Network Analysis, Information Architecture

HubSpot Academy
Skills you'll gain: Data Visualization, HubSpot CRM, Dashboard, Business Reporting, Customer Relationship Management (CRM) Software, Performance Reporting, Forecasting, Business Metrics, Sales Process, Performance Metric, Sales, Data-Driven Decision-Making, Key Performance Indicators (KPIs), Customer Service, Customer Data Management, Goal Setting

Skills you'll gain: Data Visualization Software, Data Presentation, Stata, Scatter Plots, Plot (Graphics), Box Plots, Exploratory Data Analysis, Histogram, Descriptive Statistics, Heat Maps, Graphing
 Status: New
Johns Hopkins University
Skills you'll gain: Data Visualization Software, Scientific Visualization, Interactive Data Visualization, Geospatial Information and Technology, Data Presentation, Color Theory, Graphic and Visual Design, Tree Maps, Visualization (Computer Graphics), Data Storytelling, Statistical Visualization, Design Elements And Principles, Plot (Graphics), Data Literacy, Heat Maps, Computer Displays, Exploratory Data Analysis, Time Series Analysis and Forecasting, Data Mapping, Scatter Plots

Coursera Project Network
Skills you'll gain: Infographics, Data Presentation, Interactive Data Visualization, Generative AI, Data Storytelling, Dashboard, Analytics, Artificial Intelligence, Data Visualization Software, Data Analysis

Coursera Project Network
Skills you'll gain: Interactive Data Visualization, Exploratory Data Analysis, Dashboard, Data Visualization Software, Data Integration, Heat Maps, Spatial Data Analysis, Data-Driven Decision-Making, Business Intelligence Software, Geospatial Information and Technology, Data Mapping

Skills you'll gain: Scripting, Google Workspace, Gmail, Web Development Tools, Javascript, Scripting Languages, Spreadsheet Software

Skills you'll gain: Data Visualization Software, Ggplot2, Plot (Graphics), R Programming, Scatter Plots, Data Analysis, Data Processing, Data Manipulation, Data Import/Export, Regression Analysis, Statistical Programming, Software Installation, Package and Software Management
 Status: Free
Coursera Instructor Network
Skills you'll gain: Geographic Information Systems, Geospatial Information and Technology, Geospatial Mapping, Spatial Data Analysis, Spatial Analysis, Global Positioning Systems
In summary, here are 10 of our most popular heat maps courses
- From Wellhead to Refinery: Midstream Oil and Gas Processing: L&T EduTech
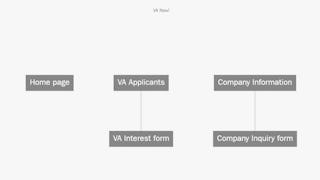
- Build a Website Map with Jumpchart: Coursera Project Network
- Carbon Aware Computing for GenAI Developers: DeepLearning.AI
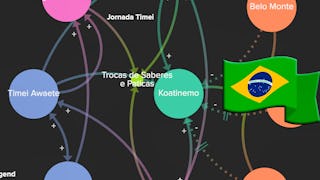
- Introdução a Mapas de Relação com Kumu: Coursera Project Network
- Sales Reporting with HubSpot: HubSpot Academy
- Data Visualization in Stata: Packt
- Data Visualization: Johns Hopkins University
- Data Analytics with Skills.AI: Create Data Visualizations: Coursera Project Network
- Dashboards in Qlik Sense: Decision-Support Dashboards: Coursera Project Network
- Google Apps Script: Access Google Sheets, Maps & Gmail in 4 Lines of Code: Google Cloud


