
Filter by
SubjectRequired
LanguageRequired
The language used throughout the course, in both instruction and assessments.
Learning ProductRequired
LevelRequired
DurationRequired
SkillsRequired
SubtitlesRequired
EducatorRequired
Results for "box plots"
 Status: New
American Psychological Association
Skills you'll gain: Sample Size Determination, Statistical Hypothesis Testing, Statistical Methods, Quantitative Research, Statistical Analysis, Probability & Statistics, Statistical Inference, Statistics, Probability Distribution, Data Analysis, Research Design, Psychology
 Status: New
Macquarie University
Skills you'll gain: Statistical Hypothesis Testing, Microsoft Excel, Statistical Inference, Descriptive Statistics, Data Analysis, Statistical Methods, Statistical Analysis, Probability & Statistics, Spreadsheet Software, Box Plots, Probability Distribution, Statistical Visualization, Histogram

Google Cloud
Skills you'll gain: Google Sheets, Data Visualization Software, Data Presentation, Pivot Tables And Charts, Spreadsheet Software, Google Workspace
 Status: Free
University of London
Skills you'll gain: Microsoft Excel, Environmental Policy, Data Analysis, Data Visualization, Descriptive Statistics, Correlation Analysis, Policy Analysis, Environmental Issue, Scatter Plots, Environmental Science, Economics, Probability & Statistics
University of Minnesota
Skills you'll gain: Health Equity, Health Disparities, Health Systems, Community Health, Public Health, Health Informatics, Healthcare Ethics, Health Policy, Maternal Health, Public Health and Disease Prevention, Statistical Analysis, Systems Thinking, Statistical Software, Box Plots, Data Ethics, Research Methodologies, Correlation Analysis, Scatter Plots, Environmental Science, Data Analysis
Coursera Project Network
Skills you'll gain: Sampling (Statistics), Statistical Methods, Descriptive Statistics, Data Visualization, Data Import/Export, Pareto Chart, Histogram, Statistical Analysis, Six Sigma Methodology, Box Plots, R Programming, Probability Distribution, Data Analysis

Coursera Project Network
Skills you'll gain: Classification And Regression Tree (CART), Applied Machine Learning, Random Forest Algorithm, Data Processing, Machine Learning Algorithms, Predictive Modeling, Regression Analysis, Feature Engineering, Machine Learning, Exploratory Data Analysis, Performance Measurement

University of California, Irvine
Skills you'll gain: Data Storytelling, Dashboard, Data Presentation, Data Visualization Software, Interactive Data Visualization, Statistical Visualization, Plot (Graphics), Tableau Software, Data Ethics, Exploratory Data Analysis, Scatter Plots, Descriptive Statistics, Heat Maps, Data Analysis, Descriptive Analytics, Geospatial Information and Technology, Histogram, Analytical Skills, Application Deployment, Network Analysis

Skills you'll gain: Plotly, Dashboard, Data Visualization Software, Interactive Data Visualization, Cascading Style Sheets (CSS), Hypertext Markup Language (HTML), Jupyter, Python Programming, Real Time Data, Pandas (Python Package), Data Manipulation

American Psychological Association
Skills you'll gain: Data Visualization, Plot (Graphics), Histogram, Data Analysis, Exploratory Data Analysis, Analysis, Graphing, Data Visualization Software, Data Literacy, Descriptive Statistics, Statistics, Probability & Statistics, Data Management, Research, Psychology
 Status: Free
Coursera Project Network
Skills you'll gain: Spatial Data Analysis, Data Visualization Software, Geospatial Mapping, Interactive Data Visualization, Scatter Plots, Software Installation

American Psychological Association
Skills you'll gain: Regression Analysis, Correlation Analysis, Statistical Software, Data Visualization, Statistical Analysis, Statistical Methods, Plot (Graphics), Descriptive Statistics, Histogram, Data Analysis, Box Plots, Exploratory Data Analysis, Analysis, Graphing, Data Visualization Software, Probability & Statistics, Quantitative Research, Statistical Visualization, Statistics, Data Literacy
In summary, here are 10 of our most popular box plots courses
- t-Tests of Hypotheses About Means: American Psychological Association
- Excel Skills for Statistics and Data Analysis: Essentials: Macquarie University
- Use Charts in Google Sheets: Google Cloud
- Doing Economics: Measuring Climate Change: University of London
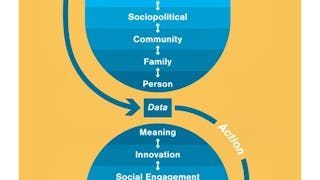
- Social Determinants of Health: Data to Action: University of Minnesota
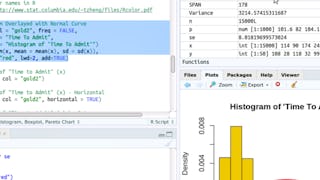
- RStudio for Six Sigma - Basic Descriptive Statistics: Coursera Project Network
- Interpretable Machine Learning Applications: Part 2: Coursera Project Network
- Use Tableau for Your Data Science Workflow: University of California, Irvine
- Python Interactive Dashboards with Plotly Dash: Packt
- How to Create and Explore a Data Set: American Psychological Association


