• For Individuals
  • For Businesses
  • For Universities
  • For Governments
Coursera
  • Online Degrees
  • Careers
  • Log In
  • Join for Free
    Coursera
    • Browse
    • Rstudio

    RStudio Courses Online

    Master RStudio for data analysis and visualization. Learn to use RStudio's tools and features for efficient data manipulation and exploration.

    Skip to search results

    Filter by

    Subject
    Required
     *

    Language
    Required
     *

    The language used throughout the course, in both instruction and assessments.

    Learning Product
    Required
     *

    Build job-relevant skills in under 2 hours with hands-on tutorials.
    Learn from top instructors with graded assignments, videos, and discussion forums.
    Get in-depth knowledge of a subject by completing a series of courses and projects.
    Earn career credentials from industry leaders that demonstrate your expertise.

    Level
    Required
     *

    Duration
    Required
     *

    Skills
    Required
     *

    Subtitles
    Required
     *

    Educator
    Required
     *

    Explore the RStudio Course Catalog

    • Status: Free Trial
      Free Trial
      I

      IBM

      Introduction to Data Science

      Skills you'll gain: SQL, Jupyter, Data Literacy, Data Mining, Peer Review, Data Modeling, Databases, Stored Procedure, Relational Databases, Database Design, Query Languages, Data Science, Database Management, Big Data, Data Cleansing, Data Visualization Software, GitHub, Business Analysis, Cloud Computing, Data Analysis

      Build toward a degree

      4.6
      Rating, 4.6 out of 5 stars
      ·
      99K reviews

      Beginner · Specialization · 3 - 6 Months

    • Status: Free Trial
      Free Trial
      D

      Duke University

      Introduction to Probability and Data with R

      Skills you'll gain: Sampling (Statistics), Exploratory Data Analysis, Statistical Inference, Probability Distribution, Bayesian Statistics, R Programming, Data Analysis, Probability, Statistics, Statistical Software, Descriptive Statistics

      4.7
      Rating, 4.7 out of 5 stars
      ·
      5.8K reviews

      Beginner · Course · 1 - 3 Months

    • U

      University of Leeds

      Statistical Methods

      Skills you'll gain: Exploratory Data Analysis, Statistical Methods, Statistical Modeling, Data Collection, Statistics, Statistical Inference, R Programming, Probability, Data Analysis, Probability Distribution, Simulations, Statistical Visualization, Descriptive Statistics

      4.8
      Rating, 4.8 out of 5 stars
      ·
      9 reviews

      Intermediate · Course · 1 - 4 Weeks

    • Status: Free Trial
      Free Trial
      C

      Codio

      Visualizing Data & Communicating Results in R with RStudio

      Skills you'll gain: Rmarkdown, Ggplot2, Statistical Visualization, Box Plots, Scatter Plots, Data Visualization, Histogram, Descriptive Statistics, Data Visualization Software, R Programming

      Beginner · Course · 1 - 3 Months

    • Status: Free Trial
      Free Trial
      D

      Duke University

      Data Visualization and Transformation with R

      Skills you'll gain: Version Control, Ggplot2, R Programming, GitHub, Data Visualization Software, Data Visualization, Statistical Methods, Git (Version Control System), Tidyverse (R Package), Exploratory Data Analysis, Data Analysis, Data Science, Data Transformation, Data-Driven Decision-Making, Statistical Programming, Statistical Analysis, Data Manipulation, Data Cleansing

      4.7
      Rating, 4.7 out of 5 stars
      ·
      11 reviews

      Beginner · Course · 1 - 4 Weeks

    • C

      Coursera Project Network

      RStudio for Six Sigma - Process Capability

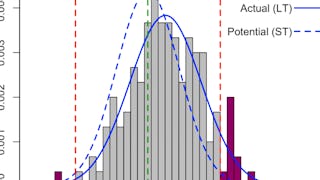
      Skills you'll gain: Process Capability, Six Sigma Methodology, Statistical Process Controls, Process Analysis, Statistical Analysis, Probability & Statistics, Statistical Methods, Business Metrics, R Programming, Data Import/Export

      4.1
      Rating, 4.1 out of 5 stars
      ·
      7 reviews

      Intermediate · Guided Project · Less Than 2 Hours

    • Status: Free Trial
      Free Trial
      J

      Johns Hopkins University

      The Data Scientist’s Toolbox

      Skills you'll gain: Rmarkdown, Version Control, Data Science, Big Data, Git (Version Control System), GitHub, Data Analysis, R Programming, Statistical Programming, Development Environment, Integrated Development Environments, Software Installation

      4.6
      Rating, 4.6 out of 5 stars
      ·
      34K reviews

      Mixed · Course · 1 - 4 Weeks

    • Status: Free Trial
      Free Trial
      P

      Packt

      Foundations of R Programming and Basic Data Manipulation

      Skills you'll gain: Rmarkdown, Data Import/Export, R Programming, Data Manipulation, Data Visualization, Web Scraping, Ggplot2, Plotly, Programming Principles, Tidyverse (R Package), Data Visualization Software, Data Wrangling, Data Cleansing, Statistical Programming, Data Transformation, Data Structures, Scripting Languages, Scripting, Development Environment

      Beginner · Course · 1 - 3 Months

    • C

      Coursera Project Network

      Forecast bikeshare demand using time series models in R

      Skills you'll gain: R Programming, Data Visualization, Time Series Analysis and Forecasting, Data-Driven Decision-Making, Trend Analysis, Rmarkdown, Data Analysis, Predictive Modeling, Data Cleansing, Data Manipulation, Forecasting, Business Strategy, Demand Planning

      5
      Rating, 5 out of 5 stars
      ·
      6 reviews

      Intermediate · Guided Project · Less Than 2 Hours

    • Status: Free
      Free
      C

      Coursera Project Network

      Data Visualization using Plotnine and ggplot

      Skills you'll gain: Exploratory Data Analysis, Box Plots, Plot (Graphics), Ggplot2, Data Visualization Software, Statistical Visualization, Scatter Plots, Histogram, Graphing

      4.6
      Rating, 4.6 out of 5 stars
      ·
      15 reviews

      Intermediate · Guided Project · Less Than 2 Hours

    • C

      Coursera Project Network

      RStudio for Six Sigma - Hypothesis Testing

      Skills you'll gain: Statistical Hypothesis Testing, Correlation Analysis, Six Sigma Methodology, R Programming, Statistical Analysis, Regression Analysis, Probability & Statistics, Data Literacy, Descriptive Statistics

      4.5
      Rating, 4.5 out of 5 stars
      ·
      10 reviews

      Intermediate · Guided Project · Less Than 2 Hours

    • U

      University of Leeds

      Exploratory Data Analysis

      Skills you'll gain: Exploratory Data Analysis, Data Cleansing, Statistical Modeling, Statistics, Data Analysis, Statistical Inference, R Programming, Descriptive Statistics, Box Plots, Data Visualization Software, Histogram, Probability, Simulations

      4.6
      Rating, 4.6 out of 5 stars
      ·
      9 reviews

      Intermediate · Course · 1 - 4 Weeks

    Rstudio learners also search

    R
    Data
    Data Analysis
    Data Science
    Data Analytics
    Analysis
    R Programming
    Beginner Data Analysis
    1234…11

    In summary, here are 10 of our most popular rstudio courses

    • Introduction to Data Science: IBM
    • Introduction to Probability and Data with R: Duke University
    • Statistical Methods: University of Leeds
    • Visualizing Data & Communicating Results in R with RStudio: Codio
    • Data Visualization and Transformation with R: Duke University
    • RStudio for Six Sigma - Process Capability: Coursera Project Network
    • The Data Scientist’s Toolbox: Johns Hopkins University
    • Foundations of R Programming and Basic Data Manipulation: Packt
    • Forecast bikeshare demand using time series models in R: Coursera Project Network
    • Data Visualization using Plotnine and ggplot: Coursera Project Network

    Skills you can learn in Data Analysis

    Analytics (85)
    Big Data (64)
    Python Programming (47)
    Business Analytics (40)
    R Programming (37)
    Statistical Analysis (36)
    Sql (33)
    Data Model (29)
    Data Mining (27)
    Exploratory Data Analysis (26)
    Data Modeling (21)
    Data Manipulation (20)

    Frequently Asked Questions about Rstudio

    RStudio is an integrated development environment (IDE) specifically designed for programming in R. It provides a user-friendly interface and a set of powerful tools for data analysis, statistical modeling, and data visualization. With RStudio, users can write and execute R scripts, create interactive data visualizations, and collaborate with others on R projects. It is widely used by data scientists, statisticians, and researchers for their data analysis and research needs.‎

    To effectively use RStudio, you need to learn the following skills:

    1. R Programming: R is a programming language used for statistical computing and graphics. Understanding the fundamentals of R programming will enable you to write scripts and code in RStudio.

    2. Data Manipulation: R provides extensive libraries and packages for data manipulation. Learning how to import, clean, organize, and transform data using RStudio will be crucial for data analysis.

    3. Data Visualization: RStudio offers powerful visualization tools to create informative and visually appealing charts, graphs, and plots. Familiarizing yourself with these visualization techniques will enhance your ability to present and communicate data effectively.

    4. Statistical Analysis: RStudio provides a broad range of statistical functions and packages to conduct various analyses. Learning statistical concepts and how to apply them using RStudio will be essential for analyzing data and deriving insights.

    5. Machine Learning: RStudio integrates with popular machine learning libraries and frameworks. Understanding the principles and algorithms of machine learning and implementing them in RStudio will allow you to develop predictive models and make data-driven decisions.

    6. Version Control: RStudio supports version control systems like Git, which enables collaborative development and maintaining a history of code changes. Learning how to use version control within RStudio will be beneficial for teamwork and project management.

    7. Reproducible Research: RStudio promotes reproducible research practices using tools like R Markdown. Understanding how to create dynamic documents that combine code, visualizations, and narrative text will help you document and share your analyses efficiently.

    8. Package Management: RStudio facilitates the installation and management of R packages. Learning how to find, install, update, and manage packages will ensure you have access to the latest functionality and resources within RStudio.

    By acquiring these skills, you will be equipped to comfortably navigate and leverage the capabilities of RStudio for data analysis, statistical modeling, and machine learning.‎

    With RStudio skills, you can pursue several job opportunities in the fields of data analysis, data science, and statistical modeling. Some of the specific job roles that you can consider are:

    1. Data Analyst: Utilize RStudio to analyze and interpret data, generate reports, and provide insights to support decision-making processes.
    2. Data Scientist: Apply RStudio for statistical analysis, machine learning, and predictive modeling to extract meaningful information from large datasets.
    3. Business Analyst: Use RStudio to perform data-driven analysis, develop forecasts, and identify trends to help businesses make informed decisions.
    4. Statistician: Utilize RStudio's statistical capabilities to conduct research, design experiments, and analyze data to solve problems in various industries.
    5. Data Visualization Specialist: Leverage RStudio's visualization libraries to create interactive and engaging data visualizations that effectively communicate patterns and insights.
    6. Research Analyst: Apply RStudio skills to analyze research data, perform statistical tests, and present findings to contribute to academic or market research.
    7. Financial Analyst: Utilize RStudio for financial data analysis, risk modeling, and forecasting in the finance industry.
    8. Data Engineer: Use RStudio to develop data pipelines, manage and clean large datasets, and ensure data quality and integrity.
    9. Epidemiologist: Apply RStudio's statistical functionalities to analyze health-related datasets, conduct disease surveillance, and investigate outbreaks.
    10. Market Research Analyst: Utilize RStudio for data analysis, customer segmentation, and market trend analysis to assist in making strategic marketing decisions.

    Having RStudio skills opens up a wide range of career opportunities in industries such as healthcare, finance, marketing, technology, and research.‎

    People who are interested in data analysis, statistics, and programming are best suited for studying RStudio. RStudio is a powerful integrated development environment (IDE) for the R programming language, which is widely used in data analysis and statistical computing. Therefore, individuals who have a strong interest in these areas and a desire to learn and apply statistical techniques using R would benefit greatly from studying RStudio. Additionally, individuals who are comfortable with programming concepts and have some prior experience with coding may find it easier to grasp the concepts and functionalities of RStudio.‎

    There are several topics that you can study that are related to RStudio, a popular integrated development environment (IDE) for R programming language. Here are some potential topics:

    1. Introduction to R Programming: Start by learning the basics of the R programming language, its syntax, data types, variables, functions, and control structures.

    2. Data Manipulation and Analysis with R: Dive into data manipulation techniques using R, including data importing/exporting, data cleaning, data wrangling, merging datasets, and performing basic data analysis tasks.

    3. Data Visualization with R: Learn different visualization techniques in R, such as creating basic plots, bar charts, scatter plots, histograms, and advanced visualizations using packages like ggplot2.

    4. Statistical Analysis with R: Explore statistical analysis concepts using R, including hypothesis testing, regression analysis, ANOVA, time series analysis, and more.

    5. Machine Learning in R: Gain an understanding of the principles and algorithms behind machine learning, and how to implement them using R. Learn about classification, regression, clustering, and evaluation of machine learning models.

    6. Web Scraping and API Integration with R: Discover how to extract data from websites using web scraping techniques and connect to APIs (Application Programming Interfaces) to retrieve data for analysis using R.

    7. Shiny App Development: Learn to build interactive web applications and dashboards using R's Shiny framework. Understand how to create intuitive user interfaces and incorporate data visualizations and analytics into your apps.

    8. R Markdown and Reproducible Research: Explore R Markdown, a powerful tool for creating dynamic reports and documents that combine code, visualizations, and narratives. Learn how to create reproducible research workflows and share your findings effectively.

    9. R Packages and Advanced R Concepts: Deepen your understanding of R by exploring advanced concepts like creating your own R packages, debugging, profiling, parallel computing, and optimization techniques.

    10. Collaboration and Version Control with RStudio: Learn how to collaborate with others on R projects, use version control systems like Git, and leverage the collaboration features in RStudio to improve productivity and ensure project integrity.

    Remember, these are just a few examples of topics related to RStudio. Depending on your specific needs and goals, you can further explore specific domains like bioinformatics, finance, data science, text mining, spatial analysis, and more, with the help of RStudio.‎

    Online RStudio courses offer a convenient and flexible way to enhance your knowledge or learn new RStudio is an integrated development environment (IDE) specifically designed for programming in R. It provides a user-friendly interface and a set of powerful tools for data analysis, statistical modeling, and data visualization. With RStudio, users can write and execute R scripts, create interactive data visualizations, and collaborate with others on R projects. It is widely used by data scientists, statisticians, and researchers for their data analysis and research needs. skills. Choose from a wide range of RStudio courses offered by top universities and industry leaders tailored to various skill levels.‎

    When looking to enhance your workforce's skills in RStudio, it's crucial to select a course that aligns with their current abilities and learning objectives. Our Skills Dashboard is an invaluable tool for identifying skill gaps and choosing the most appropriate course for effective upskilling. For a comprehensive understanding of how our courses can benefit your employees, explore the enterprise solutions we offer. Discover more about our tailored programs at Coursera for Business here.‎

    This FAQ content has been made available for informational purposes only. Learners are advised to conduct additional research to ensure that courses and other credentials pursued meet their personal, professional, and financial goals.

    Other topics to explore

    Arts and Humanities
    338 courses
    Business
    1095 courses
    Computer Science
    668 courses
    Data Science
    425 courses
    Information Technology
    145 courses
    Health
    471 courses
    Math and Logic
    70 courses
    Personal Development
    137 courses
    Physical Science and Engineering
    413 courses
    Social Sciences
    401 courses
    Language Learning
    150 courses

    Coursera Footer

    Technical Skills

    • ChatGPT
    • Coding
    • Computer Science
    • Cybersecurity
    • DevOps
    • Ethical Hacking
    • Generative AI
    • Java Programming
    • Python
    • Web Development

    Analytical Skills

    • Artificial Intelligence
    • Big Data
    • Business Analysis
    • Data Analytics
    • Data Science
    • Financial Modeling
    • Machine Learning
    • Microsoft Excel
    • Microsoft Power BI
    • SQL

    Business Skills

    • Accounting
    • Digital Marketing
    • E-commerce
    • Finance
    • Google
    • Graphic Design
    • IBM
    • Marketing
    • Project Management
    • Social Media Marketing

    Career Resources

    • Essential IT Certifications
    • High-Income Skills to Learn
    • How to Get a PMP Certification
    • How to Learn Artificial Intelligence
    • Popular Cybersecurity Certifications
    • Popular Data Analytics Certifications
    • What Does a Data Analyst Do?
    • Career Development Resources
    • Career Aptitude Test
    • Share your Coursera Learning Story

    Coursera

    • About
    • What We Offer
    • Leadership
    • Careers
    • Catalog
    • Coursera Plus
    • Professional Certificates
    • MasterTrack® Certificates
    • Degrees
    • For Enterprise
    • For Government
    • For Campus
    • Become a Partner
    • Social Impact
    • Free Courses
    • ECTS Credit Recommendations

    Community

    • Learners
    • Partners
    • Beta Testers
    • Blog
    • The Coursera Podcast
    • Tech Blog
    • Teaching Center

    More

    • Press
    • Investors
    • Terms
    • Privacy
    • Help
    • Accessibility
    • Contact
    • Articles
    • Directory
    • Affiliates
    • Modern Slavery Statement
    • Manage Cookie Preferences
    Learn Anywhere
    Download on the App Store
    Get it on Google Play
    Logo of Certified B Corporation
    © 2025 Coursera Inc. All rights reserved.
    • Coursera Facebook
    • Coursera Linkedin
    • Coursera Twitter
    • Coursera YouTube
    • Coursera Instagram
    • Coursera TikTok