• For Individuals
  • For Businesses
  • For Universities
  • For Governments
Coursera
  • Online Degrees
  • Careers
  • Log In
  • Join for Free
    Coursera
    • Browse
    • Chart Js
    Skip to search results

    Filter by

    Subject
    Required
     *

    Language
    Required
     *

    The language used throughout the course, in both instruction and assessments.

    Learning Product
    Required
     *

    Build job-relevant skills in under 2 hours with hands-on tutorials.
    Learn from top instructors with graded assignments, videos, and discussion forums.
    Learn a new tool or skill in an interactive, hands-on environment.
    Get in-depth knowledge of a subject by completing a series of courses and projects.
    Earn career credentials from industry leaders that demonstrate your expertise.

    Level
    Required
     *

    Duration
    Required
     *

    Skills
    Required
     *

    Subtitles
    Required
     *

    Educator
    Required
     *

    Results for "chart.js"

    • C

      Coursera Project Network

      Introduction to D3.js

      Skills you'll gain: Data Visualization Software, Interactive Data Visualization, Visualization (Computer Graphics), JSON, Data Mapping, Javascript

      4.2
      Rating, 4.2 out of 5 stars
      ·
      6 reviews

      Intermediate · Guided Project · Less Than 2 Hours

    • P

      Packt

      How to Visualize Data with R

      Skills you'll gain: Data Visualization Software, Ggplot2, Statistical Visualization, R Programming, Scatter Plots, Regression Analysis, Data Manipulation, Statistical Modeling, Data Analysis, Data Import/Export, Exploratory Data Analysis, Development Environment, Data Structures, Software Installation

      Intermediate · Course · 1 - 4 Weeks

    • C

      Codio

      Visualizing Data & Communicating Results in Python

      Skills you'll gain: Matplotlib, Plot (Graphics), Statistical Visualization, Data Visualization Software, Scientific Visualization, Interactive Data Visualization, Scatter Plots, Jupyter, Histogram, Box Plots, Graphing, Computer Programming, Integrated Development Environments, Animations

      Mixed · Course · 1 - 4 Weeks

    • Status: Free
      Free
      C

      Coursera Project Network

      Build a Website Map with Jumpchart

      Skills you'll gain: Wireframing, Mockups, Web Design, Information Architecture, Collaborative Software, User Experience Design, Content Management

      Beginner · Guided Project · Less Than 2 Hours

    • Status: Free
      Free
      C

      Coursera Project Network

      Data Visualization using Bokeh

      Skills you'll gain: Spatial Data Analysis, Data Visualization Software, Data Visualization, Geospatial Information and Technology, Interactive Data Visualization, Scatter Plots, Software Installation

      4.1
      Rating, 4.1 out of 5 stars
      ·
      15 reviews

      Intermediate · Guided Project · Less Than 2 Hours

    • C

      Coursera Project Network

      Covid-19 Death Medical Analysis & Visualization using Plotly

      Skills you'll gain: Plotly, Data Visualization, Datamaps, Data Visualization Software, Scatter Plots, Jupyter, Python Programming, Exploratory Data Analysis, Pandas (Python Package), Data Analysis, Medical Science and Research

      4.1
      Rating, 4.1 out of 5 stars
      ·
      12 reviews

      Beginner · Guided Project · Less Than 2 Hours

    • N

      Northeastern University

      Healthcare Information Design and Visualizations

      Skills you'll gain: Data Storytelling, Exploratory Data Analysis, Data Visualization Software, Data Presentation, Interactive Data Visualization, Infographics, Tableau Software, Dashboard, Data Analysis, Data-Driven Decision-Making, Data Ethics, Trend Analysis, Peer Review

      Beginner · Course · 1 - 4 Weeks

    • P

      Packt

      Data Visualization in Stata

      Skills you'll gain: Data Visualization Software, Data Presentation, Stata, Scatter Plots, Plot (Graphics), Box Plots, Exploratory Data Analysis, Histogram, Descriptive Statistics, Heat Maps, Graphing

      Intermediate · Course · 1 - 3 Months

    • Status: Free
      Free
      C

      Coursera Project Network

      Create an infographic with Infogram

      Skills you'll gain: Infographics, Interactive Data Visualization, Storytelling, Storyboarding, Graphic and Visual Design

      4.9
      Rating, 4.9 out of 5 stars
      ·
      9 reviews

      Beginner · Guided Project · Less Than 2 Hours

    • Status: New
      New
      P

      Packt

      70+ JavaScript Challenges - Data Structures and Algorithms

      Skills you'll gain: Data Structures, Graph Theory, Algorithms, Computational Thinking, Javascript, Debugging, Computer Science, Development Environment, Performance Tuning

      Intermediate · Course · 1 - 3 Months

    • U

      University of Illinois Urbana-Champaign

      3D Data Visualization for Science Communication

      Skills you'll gain: Data Literacy, Data Storytelling, Scientific Visualization, Visualization (Computer Graphics), Data Presentation, Data Visualization Software, Spatial Data Analysis, Computer Graphics, 3D Modeling, Video Production

      Beginner · Course · 1 - 3 Months

    • D

      Duke University

      Data Visualization with Python

      Skills you'll gain: Data Visualization Software, Data Visualization, Data Storytelling, Interactive Data Visualization, Plotly, Matplotlib, Dashboard, Seaborn, Tableau Software, Scatter Plots, Histogram, Google Sheets, Microsoft Excel, Pandas (Python Package), Data Manipulation

      4.1
      Rating, 4.1 out of 5 stars
      ·
      24 reviews

      Intermediate · Course · 1 - 4 Weeks

    Searches related to chart.js

    pivot tables and charts
    use charts in google sheets
    building candlestick charts with google sheets
    presenting data using charts with canva
    create charts and dashboard using google sheets
    create charts and dashboards using microsoft excel
    to prepare bar charts for work schedule
    conditional formatting, tables and charts in microsoft excel
    1…678…9

    In summary, here are 10 of our most popular chart.js courses

    • Introduction to D3.js: Coursera Project Network
    • How to Visualize Data with R: Packt
    • Visualizing Data & Communicating Results in Python: Codio
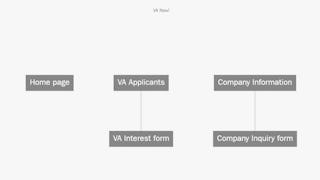
    • Build a Website Map with Jumpchart: Coursera Project Network
    • Data Visualization using Bokeh: Coursera Project Network
    • Covid-19 Death Medical Analysis & Visualization using Plotly: Coursera Project Network
    • Healthcare Information Design and Visualizations: Northeastern University
    • Data Visualization in Stata: Packt
    • Create an infographic with Infogram : Coursera Project Network
    • 70+ JavaScript Challenges - Data Structures and Algorithms: Packt

    Other topics to explore

    Arts and Humanities
    338 courses
    Business
    1095 courses
    Computer Science
    668 courses
    Data Science
    425 courses
    Information Technology
    145 courses
    Health
    471 courses
    Math and Logic
    70 courses
    Personal Development
    137 courses
    Physical Science and Engineering
    413 courses
    Social Sciences
    401 courses
    Language Learning
    150 courses

    Coursera Footer

    Technical Skills

    • ChatGPT
    • Coding
    • Computer Science
    • Cybersecurity
    • DevOps
    • Ethical Hacking
    • Generative AI
    • Java Programming
    • Python
    • Web Development

    Analytical Skills

    • Artificial Intelligence
    • Big Data
    • Business Analysis
    • Data Analytics
    • Data Science
    • Financial Modeling
    • Machine Learning
    • Microsoft Excel
    • Microsoft Power BI
    • SQL

    Business Skills

    • Accounting
    • Digital Marketing
    • E-commerce
    • Finance
    • Google
    • Graphic Design
    • IBM
    • Marketing
    • Project Management
    • Social Media Marketing

    Career Resources

    • Essential IT Certifications
    • High-Income Skills to Learn
    • How to Get a PMP Certification
    • How to Learn Artificial Intelligence
    • Popular Cybersecurity Certifications
    • Popular Data Analytics Certifications
    • What Does a Data Analyst Do?
    • Career Development Resources
    • Career Aptitude Test
    • Share your Coursera Learning Story

    Coursera

    • About
    • What We Offer
    • Leadership
    • Careers
    • Catalog
    • Coursera Plus
    • Professional Certificates
    • MasterTrack® Certificates
    • Degrees
    • For Enterprise
    • For Government
    • For Campus
    • Become a Partner
    • Social Impact
    • Free Courses
    • ECTS Credit Recommendations

    Community

    • Learners
    • Partners
    • Beta Testers
    • Blog
    • The Coursera Podcast
    • Tech Blog
    • Teaching Center

    More

    • Press
    • Investors
    • Terms
    • Privacy
    • Help
    • Accessibility
    • Contact
    • Articles
    • Directory
    • Affiliates
    • Modern Slavery Statement
    • Manage Cookie Preferences
    Learn Anywhere
    Download on the App Store
    Get it on Google Play
    Logo of Certified B Corporation
    © 2025 Coursera Inc. All rights reserved.
    • Coursera Facebook
    • Coursera Linkedin
    • Coursera Twitter
    • Coursera YouTube
    • Coursera Instagram
    • Coursera TikTok