
Filter by
SubjectRequired
LanguageRequired
The language used throughout the course, in both instruction and assessments.
Learning ProductRequired
LevelRequired
DurationRequired
SkillsRequired
SubtitlesRequired
EducatorRequired
Explore the Infographics Course Catalog

University of Illinois Urbana-Champaign
Skills you'll gain: Data Literacy, Data Storytelling, Scientific Visualization, Visualization (Computer Graphics), Data Presentation, Data Visualization Software, Spatial Data Analysis, Computer Graphics, 3D Modeling, Video Production
Coursera Project Network
Skills you'll gain: Data Storytelling, Data Presentation, Data-Driven Decision-Making, Interactive Data Visualization, Dashboard, Data Visualization Software, Tableau Software, Data Analysis, Exploratory Data Analysis

Johns Hopkins University
Skills you'll gain: Rmarkdown, Statistical Visualization, Ggplot2, Data Import/Export, Data Visualization Software, R Programming, Tidyverse (R Package), Data Manipulation, Scatter Plots, Data Wrangling, Histogram, Software Installation
Coursera Project Network
Skills you'll gain: Dashboard, Interactive Data Visualization, Data Presentation, Tableau Software, Data Visualization Software, Data Analysis Software, Digital Publishing, Key Performance Indicators (KPIs), Data Import/Export
 Status: Free
Coursera Project Network
Skills you'll gain: Education Software and Technology
 Status: Free
Coursera Project Network
Skills you'll gain: Dashboard, Google Sheets, Spreadsheet Software, Pivot Tables And Charts, Data Visualization Software, Data Presentation, Interactive Data Visualization, Excel Formulas, Data Manipulation
 Status: Free
Coursera Instructor Network
Skills you'll gain: Data Storytelling, Data Presentation, Data Visualization Software, Storytelling, Data Integrity, Data Analysis, Drive Engagement, Microsoft Excel, Design Elements And Principles, Statistical Analysis, Decision Making
 Status: Free
Coursera Project Network
Skills you'll gain: Canva (Software), Multimedia, Web Content, Infographics, Visual Design, Graphical Tools
 Status: Free
Stanford University
Skills you'll gain: Respiratory Care, Telehealth, Respiratory Therapy, Critical Care, Emergency and Intensive Care, Patient Positioning, Patient Treatment, Pediatrics, Infection Control, Patient Evaluation, Intensive Care Unit, Vital Signs, Health Assessment, Infectious Diseases, Medical Ultrasonography
 Status: Free
Coursera Project Network
Skills you'll gain: Canva (Software), Instagram, Social Media Content, Graphic and Visual Design, Social Media Marketing, Organizational Skills, Marketing Design, Typography, Color Theory
 Status: Free
Coursera Project Network
Skills you'll gain: Process Flow Diagrams, Business Process, Target Audience, Data Visualization, Content Creation, Collaborative Software

Johns Hopkins University
Skills you'll gain: Ggplot2, Plot (Graphics), Statistical Visualization, Data Visualization Software, Exploratory Data Analysis, Data Presentation, Data Storytelling, Scatter Plots, Tidyverse (R Package), R Programming, Histogram, Animations, Data Manipulation
In summary, here are 10 of our most popular infographics courses
- 3D Data Visualization for Science Communication: University of Illinois Urbana-Champaign
- Data Visualization in Tableau: Create Dashboards and Stories: Coursera Project Network
- Getting Started with Data Visualization in R: Johns Hopkins University
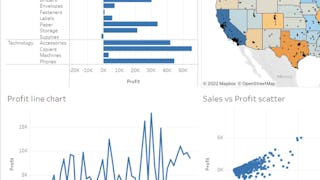
- Tableau Public for Beginners: Data Visualization Basics: Coursera Project Network
- Create Engaging Presentations with Easelly: Coursera Project Network
- Create Charts and Dashboard using Google Sheets: Coursera Project Network
- Unlocking Business Insights through Storytelling with Data: Coursera Instructor Network
- How to create presentations using Canva: Coursera Project Network
- COVID-19 Training for Healthcare Workers: Stanford University
- Crea Gráficos para las Redes Sociales con Canva: Coursera Project Network


